Open Telemetry and Azure Monitor Trace Explorer
When it comes to observability, we rely on telemetry that is captured through reliable instrumentation.
Observability
With the increased complexity of systems, identifying issues or anomalies can be a difficult task. Observability helps us to understand the application state across the different requests and dependencies in applications, helping us to find the root cause of those issues.
Open Telemetry1 is becoming a popular open-source instrumentation tool, because it helps us to identify the current state of applications more efficiently.
.NET 6, OpenTelemetry and Application Insights
Let’s implement observability using OpenTelemetry and Application Insights in a .NET 6 Minimal API.
NuGet packages are still on Release Candidate/Beta, but they are looking very promising.
I have started a new ASP.NET Core Web API, and then I added the following NuGet packages:
| |
Open Telemetry Exporters
After capturing telemetry, exporters allow the captured telemetry to be shared/consumed by other platforms, so you can visualize and analyze your traces and metrics.
In this example, I have a Console Exporter that prints telemetry, and also the Azure Monitor Exporter used in conjunction with Application Insights.
| |
We use the Application Insights Instrumentation Key on appsettings.json:
| |
.NET6 Minimal API
Using the default template created of .NET6 Minimal API, OpenTelemetry is hooked up within the weatherforecast endpoint:
| |
Note: the AddTag contains the forecast payload.
Download this example on PlayGoKids repository.
Visualize the Traces
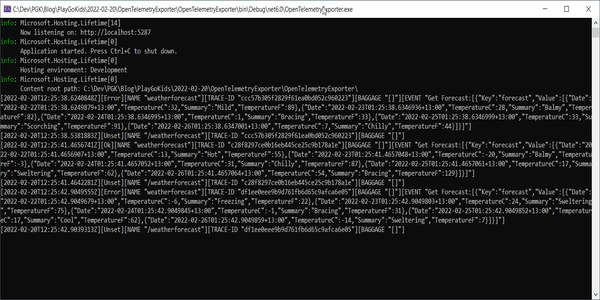
When the Console is launched, we can visualise the activity details:

Note for the highlighted Id and ParentId.
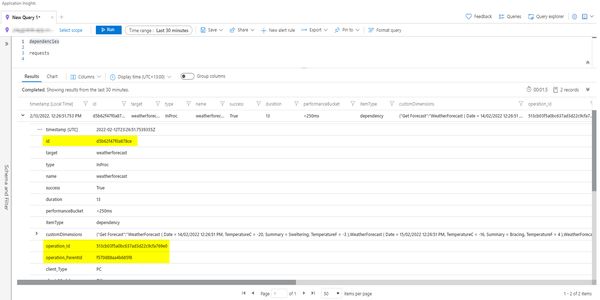
The same details are available on Application Insights:

This example shows that we can use Open Telemetry on Azure with Application Insights, and the Open Telemetry identifiers (Id and ParentId) are preserved.
If you want to learn more about Open Telemetry1, check their website for more examples.
Check this article to learn how to create a custom Open Telemetry Exporter with .NET 6.

Join the conversation! Share your thoughts and connect with other readers.