You can export traces and metrics from Open Telemetry by implementing custom exporters, and in this article, I would like to show how to create a Custom Console Exporter as an example.
Observability
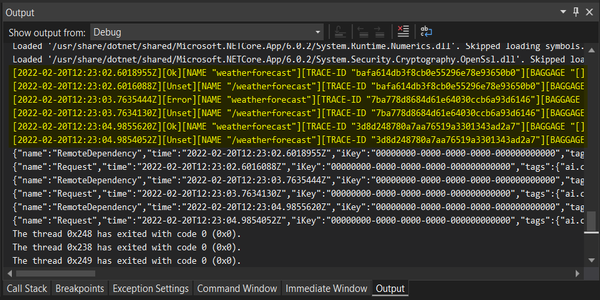
Looking at how Open Telemetry Logs are displayed on Console, it feels that a lot of information is displayed in separate chunks, which makes it very challenging for us to use the Console display as a way of troubleshooting applications. To be able to do that you need to visualize traces on a tool like Zipkin1 or Azure Monitor.
In my case, when working with Docker Containers, I wanted to visualize the Logs concisely, so I decided to create a Custom Console Exporter to allow me to do that. This becomes very important when you need to troubleshoot applications by viewing the Logs, so you can validate the output and take decisions about it.
Custom Exporter
The code below shows the implementation of an Exporter, by inheriting from BaseExporter<Activity>, and overriding the implementation of Export method.
usingSystem.Diagnostics;usingSystem.Text.Json;usingOpenTelemetry;namespaceOpenTelemetryExporter{classMyConsoleExporter:BaseExporter<Activity>{privatereadonlystring_name;publicMyConsoleExporter(stringname="MyConsoleExporter"){this._name=name;}publicoverrideExportResultExport(inBatch<Activity>batch){// SuppressInstrumentationScope should be used to prevent exporter
// code from generating telemetry and causing live-loop.
usingvarscope=SuppressInstrumentationScope.Begin();foreach(varactivityinbatch){ConsoleWriteData($"{activity.StartTimeUtc:o}");ConsoleWriteData($"{activity.Status}");ConsoleWriteData("NAME",activity.DisplayName);ConsoleWriteData("TRACE-ID",activity.TraceId.ToString());ConsoleWriteData("BAGGAGE",JsonSerializer.Serialize(activity.Baggage));foreach(varevinactivity.Events){ConsoleWriteData("EVENT",$"{ev.Name}:{JsonSerializer.Serialize(ev.Tags)}");}Console.WriteLine();}returnExportResult.Success;}privatevoidConsoleWriteData(stringtitle,string?content=null){Console.Write(!string.IsNullOrEmpty(content)?$"[{title} \"{content}\"]":$"[{title}]");}}}
Adding the Exporter
The exporter needs to be hooked up to the TraceProviderBuilder, and to do that the following extension was created, the AddMyConsoleExporter extension:
The extension is then added to the providerBuilder, and it will allow for Traces to be logged on Console:
 1
 2
 3
 4
 5
 6
 7
 8
 9
10
11
12
13
14
builder.Services.AddOpenTelemetryTracing(providerBuilder=>{providerBuilder.AddMyConsoleExporter()// this is a custom exporter
.AddSource(serviceName).SetResourceBuilder(ResourceBuilder.CreateDefault().AddService(serviceName:serviceName,serviceVersion:serviceVersion)).AddAspNetCoreInstrumentation().AddAzureMonitorTraceExporter(o=>{o.ConnectionString=builder.Configuration.GetSection("AzureMonitorTrace").Value;});});
For more details about the AzureMonitorTraceExporter, check this article


Join the conversation! Share your thoughts and connect with other readers.